 ← PostgreSQL Blog
How to Install and Configure Node Exporter on RHEL9
How to Install and Configure Node Exporter on RHEL9
Node Exporter Setup
Create a Directory and Navigate to it:
mkdir /opt/node_exporter

cd /opt/node_exporter/
Download Node Exporter:
wget https://github.com/prometheus/node_exporter/releases/download/v1.6.1/node_exporter-1.6.1.linux-amd64.tar.gzExtract Node Exporter:
tar -xzvf node_exporter-1.6.1.linux-amd64.tar.gzMove Node Exporter Binary:
mv node_exporter-1.6.1.linux-amd64/node_exporter /usr/local/bin/node_exporterCreate a Service File:
nano /etc/systemd/system/node-exporter.servicePaste the Following Configuration into the File and Save it:
[Unit]
Description=Node
Exporter After=network.target

[Service]
User=root
Group=root
Type=simple
ExecStart=/usr/local/bin/node_exporter

[Install]
WantedBy=multi-user.target
Reload Systemd Manager Configuration:
systemctl daemon-reloadEnable Node Exporter Service to Start on Boot:
systemctl enable node-exporterStart Node Exporter Service:
systemctl start node-exporterCheck Node Exporter Status:
systemctl status node-exporterThe URL http://10.5.56.68:9100/metrics is where you can access the metrics exposed by Node Exporter. This URL provides a list of various metrics related to system performance such as CPU usage, memory usage, disk I/O statistics, network statistics, and more. If you access this URL, it will display these metrics in a text format, allowing you to monitor your system's health and performance.
nano /etc/prometheus/prometheus.ymlYou can edit
nano /etc/prometheus/prometheus.yml
# my global config
global:
  scrape_interval: 15s # Set the scrape interval to every 15 seconds. Default is every 1 minute.
  evaluation_interval: 15s # Evaluate rules every 15 seconds. The default is every 1 minute.
  # scrape_timeout is set to the global default (10s).
# Alertmanager configuration
alerting:
  alertmanagers:
    - static_configs:
        - targets:
          # - alertmanager:9093
# Load rules once and periodically evaluate them according to the global 'evaluation_interval'.
rule_files:
  # - "first_rules.yml"
  # - "second_rules.yml"
# A scrape configuration containing exactly one endpoint to scrape:
# Here it's Prometheus itself.
scrape_configs:
  # The job name is added as a label `job=<job_name>` to any timeseries scraped from this config.
  - job_name: "prometheus"
    # metrics_path defaults to '/metrics'
    # scheme defaults to 'http'.
    static_configs:
      - targets: ["localhost:9090"]

- job_name: "node_exporter"
    static_configs:
      #- targets: ["10.**.**.**:9100"]
      - targets: ["10.**.**.***:9100","10.*.**.***:9100","10.*.**.***:9100"]
- job_name: "postgres_exporter"
    static_configs:
      - targets: ["10.*.**.**:9187","10.*.**.***:9187","10.*.**.***:9187"]
Restart your servise
systemctl restart prometheus.service
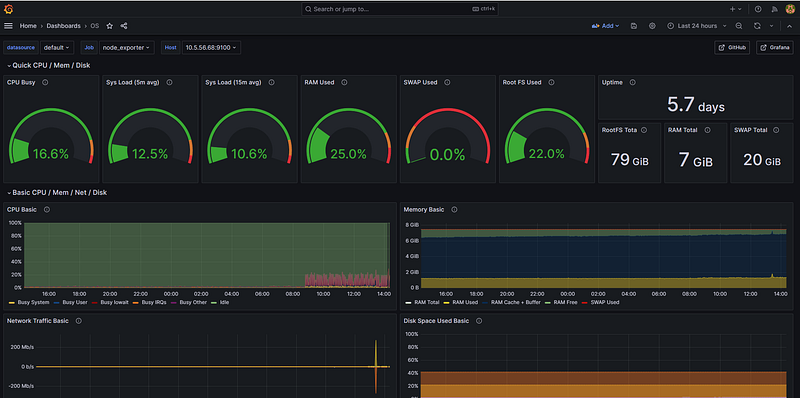
systemctl status prometheus.serviceYou can monitor your node using grafana
For more detailed and technical articles like this, keep following our blog on Medium. If you have any questions or need further assistance, feel free to reach out in the comments below and directly.