 ← PostgreSQL Blog
How to Install and Configure Postgres Exporter on RHEL9
How to Install and Configure Postgres Exporter on RHEL9
Postgres Exporter setup
Create the postgres_exporter directory.
mkdir /opt/postgres_exporterEnter the created directory.
cd /opt/postgres_exporterDownload Prometheus Postgres Exporter from the following link.
wget https://github.com/prometheus-community/postgres_exporter/releases/download/v0.12.1/postgres_exporter-0.12.1.linux-amd64.tar.gzUnpack the downloaded package.
tar -xzvf postgres_exporter-0.12.1.linux-amd64.tar.gzNavigate into the extracted package directory.
cd postgres_exporter-0.12.1.linux-amd64Move the postgres_exporter package to be able to run as a service.
cp postgres_exporter /usr/local/binReturn to the created directory.
cd /opt/postgres_exporterCreate postgres_exporter.env file to hold environment variables.
nano postgres_exporter.envSave and exit after entering the following settings.
PG_EXPORTER_EXTEND_QUERY_PATH="/opt/postgres_exporter/queries.yaml"
DATA_SOURCE_NAME="postgresql://postgres:kemal123@localhost:5432/?sslmode=disable"

/* please enter your server ip adreses with localhost */
Additionally, define the queries.yaml file for extra metrics. Use this file to add additional metrics to your database.
nano queries.yaml
pg_replication:
  query: "SELECT CASE WHEN NOT pg_is_in_recovery() THEN 0 ELSE GREATEST (0, EXTRACT(EPOCH FROM (now() - pg_last_xact_replay_timestamp()))) END AS lag"
  master: true
  metrics:
    - lag:
        usage: "GAUGE"
        description: "Replication lag behind master in seconds"
pg_postmaster:
  query: "SELECT pg_postmaster_start_time as start_time_seconds from pg_postmaster_start_time()"
  master: true
  metrics:
    - start_time_seconds:
        usage: "GAUGE"
        description: "Time at which postmaster started"
pg_database:
  query: "SELECT sum(pg_database_size(pg_database.datname)) as size FROM pg_database"
  master: true
  metrics:
    - size:
        usage: "GAUGE"
        description: "DB Size"
pg_stat_user_tables:
  query: "SELECT
     current_database() datname,
     schemaname,
     relname,
     seq_scan,
     seq_tup_read,
     idx_scan,
     idx_tup_fetch,
     n_tup_ins,
     n_tup_upd,
     n_tup_del,
     n_tup_hot_upd,
     n_live_tup,
     n_dead_tup,
     n_mod_since_analyze,
     COALESCE(last_vacuum, '1970-01-01Z') as last_vacuum,
     COALESCE(last_autovacuum, '1970-01-01Z') as last_autovacuum,
     COALESCE(last_analyze, '1970-01-01Z') as last_analyze,
     COALESCE(last_autoanalyze, '1970-01-01Z') as last_autoanalyze,
     vacuum_count,
     autovacuum_count,
     analyze_count,
     autoanalyze_count
   FROM
     pg_stat_user_tables"
  metrics:
    - datname:
        usage: "LABEL"
        description: "Name of current database"
    - schemaname:
        usage: "LABEL"
        description: "Name of the schema that this table is in"
    - relname:
        usage: "LABEL"
        description: "Name of this table"
    - seq_scan:
        usage: "COUNTER"
        description: "Number of sequential scans initiated on this table"
    - seq_tup_read:
        usage: "COUNTER"
        description: "Number of live rows fetched by sequential scans"
    - idx_scan:
        usage: "COUNTER"
        description: "Number of index scans initiated on this table"
    - idx_tup_fetch:
        usage: "COUNTER"
        description: "Number of live rows fetched by index scans"
    - n_tup_ins:
        usage: "COUNTER"
        description: "Number of rows inserted"
    - n_tup_upd:
        usage: "COUNTER"
        description: "Number of rows updated"
    - n_tup_del:
        usage: "COUNTER"
        description: "Number of rows deleted"
    - n_tup_hot_upd:
        usage: "COUNTER"
        description: "Number of rows HOT updated (i.e., with no separate index update required)"
    - n_live_tup:
        usage: "GAUGE"
        description: "Estimated number of live rows"
    - n_dead_tup:
        usage: "GAUGE"
        description: "Estimated number of dead rows"
    - n_mod_since_analyze:
        usage: "GAUGE"
        description: "Estimated number of rows changed since last analyze"
    - last_vacuum:
        usage: "GAUGE"
        description: "Last time at which this table was manually vacuumed (not counting VACUUM FULL)"
    - last_autovacuum:
        usage: "GAUGE"
        description: "Last time at which this table was vacuumed by the autovacuum daemon"
    - last_analyze:
        usage: "GAUGE"
        description: "Last time at which this table was manually analyzed"
    - last_autoanalyze:
        usage: "GAUGE"
        description: "Last time at which this table was analyzed by the autovacuum daemon"
    - vacuum_count:
        usage: "COUNTER"
        description: "Number of times this table has been manually vacuumed (not counting VACUUM FULL)"
    - autovacuum_count:
        usage: "COUNTER"
        description: "Number of times this table has been vacuumed by the autovacuum daemon"
    - analyze_count:
        usage: "COUNTER"
        description: "Number of times this table has been manually analyzed"
    - autoanalyze_count:
        usage: "COUNTER"
        description: "Number of times this table has been analyzed by the autovacuum daemon"
pg_statio_user_tables:
  query: "SELECT current_database() datname, schemaname, relname, heap_blks_read, heap_blks_hit, idx_blks_read, idx_blks_hit, toast_blks_read, toast_blks_hit, tidx_blks_read, tidx_blks_hit FROM pg_statio_user_tables"
  metrics:
    - datname:
        usage: "LABEL"
        description: "Name of current database"
    - schemaname:
        usage: "LABEL"
        description: "Name of the schema that this table is in"
    - relname:
        usage: "LABEL"
        description: "Name of this table"
    - heap_blks_read:
        usage: "COUNTER"
        description: "Number of disk blocks read from this table"
    - heap_blks_hit:
        usage: "COUNTER"
        description: "Number of buffer hits in this table"
    - idx_blks_read:
        usage: "COUNTER"
        description: "Number of disk blocks read from all indexes on this table"
    - idx_blks_hit:
        usage: "COUNTER"
        description: "Number of buffer hits in all indexes on this table"
    - toast_blks_read:
        usage: "COUNTER"
        description: "Number of disk blocks read from this table's TOAST table (if any)"
    - toast_blks_hit:
        usage: "COUNTER"
        description: "Number of buffer hits in this table's TOAST table (if any)"
    - tidx_blks_read:
        usage: "COUNTER"
        description: "Number of disk blocks read from this table's TOAST table indexes (if any)"
    - tidx_blks_hit:
        usage: "COUNTER"
        description: "Number of buffer hits in this table's TOAST table indexes (if any)"
pg_stat_statements:
  query: "select
      t2.rolname,
      t3.datname,
      queryid,
      calls,
      (total_plan_time + total_exec_time) / 1000 as total_time_seconds,
      (min_plan_time + min_exec_time) / 1000 as min_time_seconds,
      (max_plan_time + max_exec_time) / 1000 as max_time_seconds,
      (mean_plan_time + mean_exec_time) / 1000 as mean_time_seconds,
      (stddev_plan_time + stddev_exec_time) / 1000 as stddev_time_seconds,
      rows,
      shared_blks_hit,
      shared_blks_read,
      shared_blks_dirtied,
      shared_blks_written,
      local_blks_hit,
      local_blks_read,
      local_blks_dirtied,
      local_blks_written,
      temp_blks_read,
      temp_blks_written,
      blk_read_time / 1000 as blk_read_time_seconds,
      blk_write_time / 1000 as blk_write_time_seconds
from
      pg_stat_statements t1
join pg_roles t2 on
      (t1.userid = t2.oid)
join pg_database t3 on
      (t1.dbid = t3.oid)
where
      t2.rolname != 'rdsadmin'"
  master: true
  metrics:
    - rolname:
        usage: "LABEL"
        description: "Name of user"
    - datname:
        usage: "LABEL"
        description: "Name of database"
    - queryid:
        usage: "LABEL"
        description: "Query ID"
    - calls:
        usage: "COUNTER"
        description: "Number of times executed"
    - total_time_seconds:
        usage: "COUNTER"
        description: "Total time spent in the statement, in milliseconds"
    - min_time_seconds:
        usage: "GAUGE"
        description: "Minimum time spent in the statement, in milliseconds"
    - max_time_seconds:
        usage: "GAUGE"
        description: "Maximum time spent in the statement, in milliseconds"
    - mean_time_seconds:
        usage: "GAUGE"
        description: "Mean time spent in the statement, in milliseconds"
    - stddev_time_seconds:
        usage: "GAUGE"
        description: "Population standard deviation of time spent in the statement, in milliseconds"
    - rows:
        usage: "COUNTER"
        description: "Total number of rows retrieved or affected by the statement"
    - shared_blks_hit:
        usage: "COUNTER"
        description: "Total number of shared block cache hits by the statement"
    - shared_blks_read:
        usage: "COUNTER"
        description: "Total number of shared blocks read by the statement"
    - shared_blks_dirtied:
        usage: "COUNTER"
        description: "Total number of shared blocks dirtied by the statement"
    - shared_blks_written:
        usage: "COUNTER"
        description: "Total number of shared blocks written by the statement"
    - local_blks_hit:
        usage: "COUNTER"
        description: "Total number of local block cache hits by the statement"
    - local_blks_read:
        usage: "COUNTER"
        description: "Total number of local blocks read by the statement"
    - local_blks_dirtied:
        usage: "COUNTER"
        description: "Total number of local blocks dirtied by the statement"
    - local_blks_written:
        usage: "COUNTER"
        description: "Total number of local blocks written by the statement"
    - temp_blks_read:
        usage: "COUNTER"
        description: "Total number of temp blocks read by the statement"
    - temp_blks_written:
        usage: "COUNTER"
        description: "Total number of temp blocks written by the statement"
    - blk_read_time_seconds:
        usage: "COUNTER"
        description: "Total time the statement spent reading blocks, in milliseconds (if track_io_timing is enabled, otherwise zero)"
    - blk_write_time_seconds:
        usage: "COUNTER"
        description: "Total time the statement spent writing blocks, in milliseconds (if track_io_timing is enabled, otherwise zero)"
pg_process_idle:
  query: |
    WITH
      metrics AS (
        SELECT
          application_name,
          SUM(EXTRACT(EPOCH FROM (CURRENT_TIMESTAMP - state_change))::bigint)::float AS process_idle_seconds_sum,
          COUNT(*) AS process_idle_seconds_count
        FROM pg_stat_activity
        WHERE state = 'idle'
        GROUP BY application_name
      ),
      buckets AS (
        SELECT
          application_name,
          le,
          SUM(
            CASE WHEN EXTRACT(EPOCH FROM (CURRENT_TIMESTAMP - state_change)) <= le
              THEN 1
              ELSE 0
            END
          )::bigint AS bucket
        FROM
          pg_stat_activity,
          UNNEST(ARRAY[1, 2, 5, 15, 30, 60, 90, 120, 300]) AS le
        GROUP BY application_name, le
        ORDER BY application_name, le
      )
    SELECT
      application_name,
      process_idle_seconds_sum as seconds_sum,
      process_idle_seconds_count as seconds_count,
      ARRAY_AGG(le) AS seconds,
      ARRAY_AGG(bucket) AS seconds_bucket
    FROM metrics JOIN buckets USING (application_name)
    GROUP BY 1, 2, 3
  metrics:
    - application_name:
        usage: "LABEL"
        description: "Application Name"
    - seconds:
        usage: "HISTOGRAM"
        description: "Idle time of server processes"
pg_active_lockedsql:
  query: |
    select case  when replace(replace(pg_blocking_pids(pid)::text,'{',''),'}','')='' then 'numsofnopidblock'  else 'numsofsomepidblock' end  pidblock,
    count(1) pidnums from pg_stat_activity
    where state not in('idle') and query !=''  group by pidblock order by pidblock;
  metrics:
    - pidblock:
        usage: "LABEL"
        description: "Possible values:numsofnopidblock--The processes that are not locked; numsofsomepidblock--The processes locked by some "
    - pidnums:
        usage: "COUNTER"
        description: "The number of processes"
pg_active_slowsql:
  query: |
    select datname,usename,count(1) slowsql_count
    from pg_stat_activity where state not in('idle') and query !=''
    and extract(epoch from (now() - query_start)) > 60*5 group by datname,usename order by count(1) desc;
  metrics:
    - datname:
        usage: "LABEL"
        description: "Name of database"
    - usename:
        usage: "LABEL"
        description: "Name of user"
    - slowsql_count:
        usage: "COUNTER"
        description: "the numbers of slow sqls"
pg_never_used_indexes:
  query: |
    select pi.schemaname, pi.relname, pi.indexrelname,
    pg_table_size(pi.indexrelid) as index_size from pg_indexes pis join
    pg_stat_user_indexes pi on pis.schemaname = pi.schemaname
    and pis.tablename = pi.relname and pis.indexname = pi.indexrelname
    left join pg_constraint pco on pco.conname = pi.indexrelname
    and pco.conrelid = pi.relid where pco.contype is distinct from 'p'
    and pco.contype is distinct from 'u' and (idx_scan,idx_tup_read,idx_tup_fetch) = (0,0,0)
    and pis.indexdef !~ ' UNIQUE INDEX ' and pi.relname !~ 'backup$'
    order by pg_table_size(indexrelid) desc;
  metrics:
    - schemaname:
        usage: "LABEL"
        description: "Schema of table"
    - relname:
        usage: "LABEL"
        description: "Name of table"
    - indexrelname:
        usage: "LABEL"
        description: "Name of index"
    - index_size:
        usage: "GAUGE"
        description: "Size of index"
pg_tablelocktops:
  query: |
    select  db.datname,relname tbname,mode locktype,count(1) locknums
    from pg_database db join pg_locks lk on db.oid=lk.database
    join pg_class cl on lk.relation=cl.oid
    join pg_stat_activity act on lk.pid=act.pid
    where db.datname not in ('template0','template1') and fastpath='t'
    and cl.oid not in (select oid from pg_class where relname in ('pg_class','pg_locks'))
    and act.pid  <>pg_backend_pid() and cl.reltablespace in (select oid from pg_tablespace)
    group by db.datname,relname,mode order by count(1) desc limit 10;
  metrics:
    - datname:
        usage: "LABEL"
        description: "database of table"
    - tbname:
        usage: "LABEL"
        description: "Name of table"
    - locktype:
        usage: "LABEL"
        description: "type of lock"
    - locknums:
        usage: "COUNTER"
        description: "the numbers of this lock"
Create a service file for Postgres Exporter.
nano /etc/systemd/system/postgres_exporter.serviceSave and exit after entering the following settings.
[Unit]
Description=Prometheus exporter for Postgresql
Wants=network-online.target
After=network-online.target

[Service]
User=postgres
Group=postgres
WorkingDirectory=/opt/postgres_exporter
EnvironmentFile=/opt/postgres_exporter/postgres_exporter.env
ExecStart=/usr/local/bin/postgres_exporter --web.listen-address=:9187 --web.telemetry-path=/metrics
Restart=always
[Install]
WantedBy=multi-user.target
Load the changes made in the service file.
systemctl daemon-reloadAutomatically start on OS reboot.
systemctl enable postgres_exporterStart the service.
systemctl start postgres_exporterCheck the service status.
systemctl status postgres_exporterThe URL http://10.5.56.68:9187/metrics is where you can access the metrics exposed by Postgres Exporter. This URL provides a list of various metrics related to database performance and more. If you access this URL, it will display these metrics in a text format, allowing you to monitor your system's health and performance.
Prometheus Config Update and Control
nano /etc/prometheus/prometheus.yml
nano /etc/prometheus/prometheus.yml
# my global config
global:
  scrape_interval: 15s # Set the scrape interval to every 15 seconds. Default is every 1 minute.
  evaluation_interval: 15s # Evaluate rules every 15 seconds. The default is every 1 minute.
  # scrape_timeout is set to the global default (10s).

# Alertmanager configuration
alerting:
  alertmanagers:
    - static_configs:
        - targets:
          # - alertmanager:9093

# Load rules once and periodically evaluate them according to the global 'evaluation_interval'.
rule_files:
  # - "first_rules.yml"
  # - "second_rules.yml"

# A scrape configuration containing exactly one endpoint to scrape:
# Here it's Prometheus itself.
scrape_configs:
  # The job name is added as a label `job=<job_name>` to any timeseries scraped from this config.
  - job_name: "prometheus"

    # metrics_path defaults to '/metrics'
    # scheme defaults to 'http'.

    static_configs:
      - targets: ["localhost:9090"]


  - job_name: "postgres_exporter"
    static_configs:
      - targets: ["10.**.**.68:9187"]

# You want to multiple service please add below configuration instead of above
  - job_name: "postgres_exporter"
    static_configs:
      - targets: ["10.**.**.**3:9187","10.**.**.**4:9187","10.**.**.**5:9187"]


systemctl restart prometheus.service
systemctl status prometheus.service
You can monitor your database using grafana
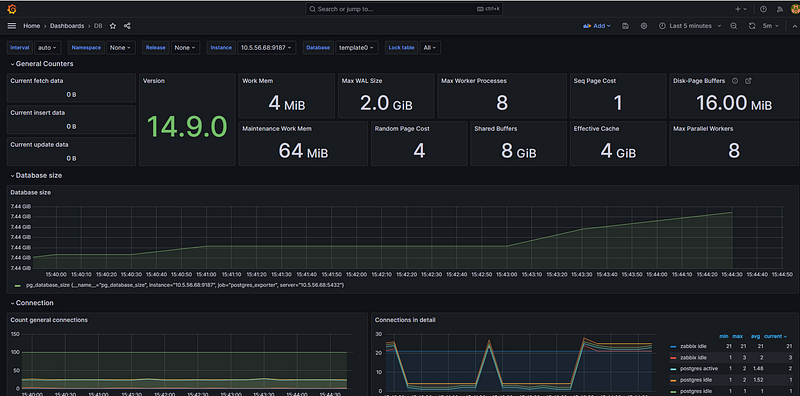
For more detailed and technical articles like this, keep following our blog on Medium. If you have any questions or need further assistance, feel free to reach out in the comments below and directly.