 ← PostgreSQL Blog
Historic Workload Reports For postgres
Historic Workload Reports For postgres
Historic Workload Reports offer insights into past database activities, helping to analyze performance, identify issues, and optimize PostgreSQL databases. Using tools like pg_profile, these reports capture and present historical data on query performance, resource usage, and more, aiding in informed decision-making for database maintenance and tuning.

Download and Installation:
- The first step is to download the pg_profile extension from its GitHub releases page as shown below figure. This extension provides tools for monitoring and analyzing workload in PostgreSQL databases.

- You can use the
wgetcommand to download the.tar.gzfile from the specified release.
wget https://github.com/zubkov-andrei/pg_profile/releases/download/4.3/pg_profile--4.3.tar.gz- Once downloaded, you need to extract the contents of the archive to the extension directory of your PostgreSQL installation. The
tarcommand is used for this purpose.
tar -xzf pg_profile - 4.3.tar.gz -C /usr/pgsql-14/share/extension/- After extraction, you can verify the presence of the extension files in the PostgreSQL extension directory using
ls.
ls -ltr /usr/pgsql-14/share/extension/ | grep pg_profileConfiguration:
- Next, you need to configure PostgreSQL to load the
pg_stat_statementsmodule and enable various tracking parameters. These settings are essential for collecting workload information. - Edit the
postgresql.conffile (or Patroni configuration if you're using Patroni for managing PostgreSQL) and add/modify the following settings:
vi /var/lib/pgsql/14/data/postgresql.conf

# You can use patroni edit configuration if you use
patronictl -c /etc/patroni/patroni.yml edit-config
# for Postgresql.conf

shared_preload_libraries = 'pg_stat_statements'
track_activities = on
track_counts = on
track_io_timing = on
track_functions = all
# Snapshot age parameters
# Adjust the parameters related to snapshot age and top-N queries according to your
pg_profile.max_sample_age = 7
pg_profile.topn = 20


# for patroni edit-config
shared_preload_libraries: pg_stat_statements
 track_activities: true
 track_counts: true
 track_functions: all
 track_io_timing: true
 pg_profile.max_sample_age: 30
 pg_profile.topn: 10
Extension and Schema Setup:
- Create the required extensions and schema for pg_profile:
CREATE EXTENSION dblink;
CREATE EXTENSION pg_stat_statements;
CREATE SCHEMA profile;
CREATE EXTENSION pg_profile SCHEMA profile;
Usage:
- You can now interact with the pg_profile extension to gather workload information and generate reports.
- Commands like
profile.show_servers(),profile.take_sample(),profile.snapshot(), andprofile.show_samples()are available to manage and view collected data.
select * from profile.show_servers();
select * from profile.take_sample();
select * from profile.snapshot();
select * from profile.show_samples();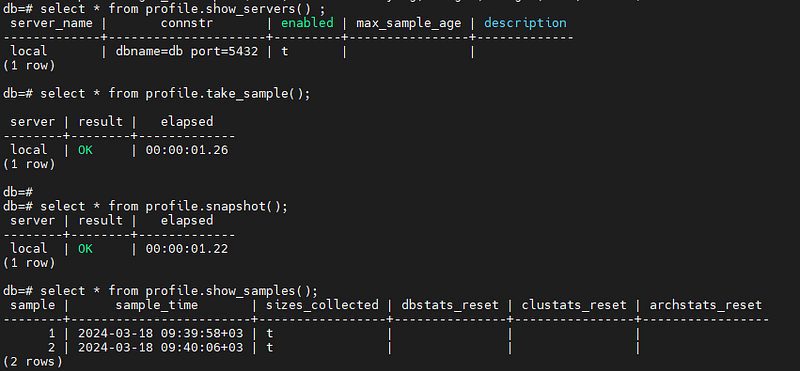
- Finally, you can generate a report using
psqlwith theprofile.get_report()function, specifying the desired snapshot IDs. For example:
psql -Aqtc "SELECT profile.get_report(1,2)" -o report_1_2.html- Also, you can take a profile sample each 30 minutes
# Scheduling Snapshot
*/30 * * * * psql -U postgres -d postgres -c ‘SELECT profile.take_sample()’ > /dev/null 2>&1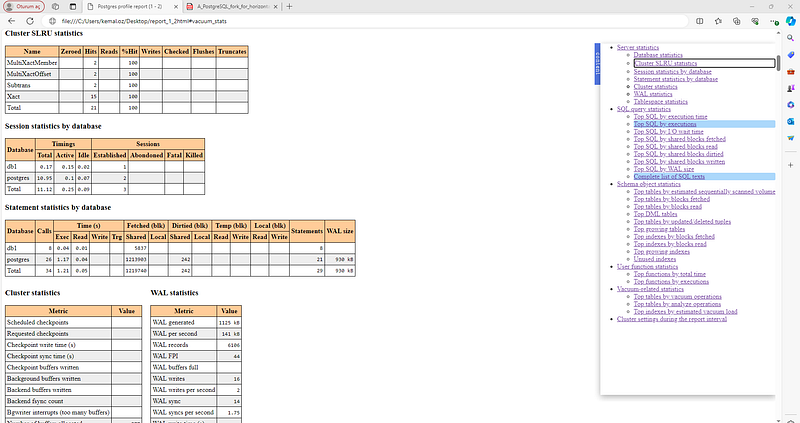
For more detailed and technical articles like this, keep following our blog on Medium. If you have any questions or need further assistance, feel free to reach out in the comments below and directly.