 ← PostgreSQL Blog
Debugging Log Files and PgBadger
Debugging Log Files and PgBadger
Debugging PostgreSQL performance issues often involves sifting through extensive log files to identify bottlenecks and errors. PgBadger, a powerful log analyzer for PostgreSQL, simplifies this process by providing insightful reports and metrics. In this guide, we’ll explore how to use PgBadger to analyze PostgreSQL log files effectively.
logging_collector
- Description: When enabled, a background process captures messages sent to stderr and redirects them to log files.
- Default: Off.
- Importance: Enabling this parameter ensures comprehensive logging without loss of messages, especially critical under high workloads.
log_destination
- Description: Determines where log output is directed.
- Default: stderr (text format).
- Other Options: csvlog (comma-separated format).
- Importance: Choosing the appropriate destination facilitates compatibility with external analyzers or applications.
log_directory
- Description: Specifies the directory for storing log files.
- Dependent: Requires logging_collector to be enabled.
- Recommendation: Use separate storage to prevent disk congestion, particularly under heavy workloads.
log_filename
- Description: Defines the naming convention for log files.
- Dependent: Requires logging_collector to be enabled.
- Example: postgresql-%Y-%m-%d_%H%M%S.log.
- Importance: Establishes a consistent naming scheme for organized log management.
log_rotation_age
- Description: Controls time-based log rotation.
- Default: 24 hours (1440 minutes).
- Flexibility: Can be set to 0 to deactivate time-based rotation.
- Recommendation: Adjust based on workload; daily rotation is typical but weekly rotation may suffice for lighter usage.
log_rotation_size
- Description: Manages size-based log rotation.
- Default: 10MB.
- Zero Option: Setting to 0 disables size-based rotation.
- Importance: Prevents log files from growing excessively, ensuring efficient disk usage.
log_truncate_on_rotation
- Description: Determines whether existing log files are appended or overwritten upon rotation.
- Dependent: Requires logging_collector to be enabled.
- Functionality: Enables control over the number of log files stored.
- Example: If log_filename is configured with hourly rotation, PostgreSQL retains a limited number of files based on this parameter.
log_line_prefix
- Description: Prefix added to each log line.
- Example: ‘%t [%p]: [%l-1] user=%u,db=%d,host=%h,app=%a,cilent=%h ‘
- Importance: Formats log lines for better readability and understanding of information.
log_connections / log_disconnections
- Description: Determines whether connection establishment and disconnection operations are logged.
- Importance: Useful for tracking database connection and disconnection events.
log_min_duration_statement
- Description: Controls logging of SQL statements that take longer than a specified duration.
- Importance: Helps identify long-running queries to diagnose performance issues.
log_lock_waits
- Description: Determines whether lock wait situations are logged.
- Importance: Lock wait situations provide important clues for identifying causes of performance issues.
log_autovacuum_min_duration
- Description: Controls logging of autovacuum operations that take longer than a specified duration.
- Importance: Useful for monitoring and adjusting autovacuum operation performance.
These parameters make PostgreSQL log content more meaningful, facilitating easier monitoring of database operations and debugging.
log_autovacuum_min_duration: 5000
log_checkpoints: true
log_connections: true
log_directory: /pg_log/log
log_disconnections: true
log_filename: postgresql-%Y-%m-%d_%H%M%S.log
log_line_prefix: '%t [%p]: [%l-1] user=%u,db=%d,host=%h,app=%a,cilent=%h '
log_lock_waits: true
log_min_duration_statement: 5000
log_statement: ddl
log_temp_files: 0
Installing and Using PgBadger
Once PostgreSQL logging is configured, install PgBadger to streamline log analysis:
dnf install pgbadgerPgBadger can parse PostgreSQL logs and generate HTML reports with valuable insights. Let’s create a report using PgBadger:
pgbadger /pg_log/log/postgresql-2024–03-* -o /tmp/index.htmlAnalyzing PgBadger Reports
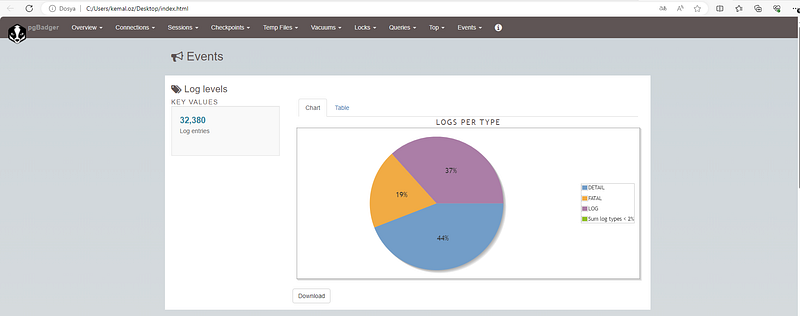
PgBadger reports provide a wealth of information, including:
- Overview: Summarizes key metrics like total requests, errors, and slow queries.
- Timeline: Visualizes database activity over time, highlighting peaks and troughs.
- Top Queries: Identifies the most time-consuming queries and their execution frequencies.
- Error Analysis: Pinpoints errors and exceptions encountered during database operations.
- Performance Optimization Suggestions: Offers recommendations for improving database performance based on observed patterns.
For more detailed and technical articles like this, keep following our blog on Medium. If you have any questions or need further assistance, feel free to reach out in the comments below and directly.