 ← PostgreSQL Blog
Setting Up Loki and Promtail for PostgreSQL Log Monitoring
Setting Up Loki and Promtail for PostgreSQL Log Monitoring
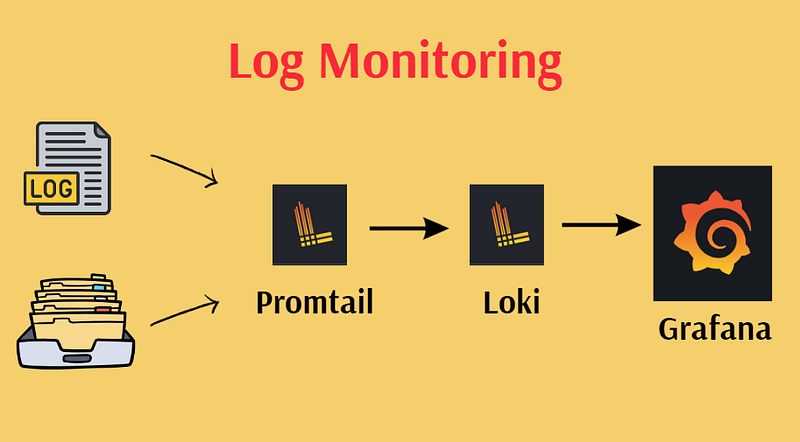
Monitoring and logging are crucial components for maintaining a healthy and robust system architecture. Among the popular tools for log aggregation, Loki, a log aggregation system from Grafana, and Promtail, its log shipping agent, stand out due to their efficiency and ease of use. This guide will walk you through setting up Loki and Promtail to monitor PostgreSQL logs, step by step. By the end of this tutorial, you will have a fully functioning log monitoring system that captures and visualizes PostgreSQL logs.
Prerequisites
Before we begin, ensure you have the following:
- A Linux server (this guide assumes a Debian-based distribution, but it can be adapted for others).
- Root or sudo access to the server.
- PostgreSQL installed and running.
Step 1: Install Loki
1.1 Create Loki Directory
First, we need to create a directory for Loki. This directory will store Loki binaries and configuration files.
mkdir /opt/loki
cd /opt/loki
1.2 Download and Extract Loki
Download the latest Loki release from GitHub and extract it.
wget https://github.com/grafana/loki/releases/download/v2.9.8/loki-linux-amd64.zip
unzip loki-linux-amd64.zip
1.3 Create Necessary Directories
Create directories for Loki to use during its operation.
mkdir /tmp/loki
mkdir /loki
1.4 Configure Loki
Create a configuration file for Loki. Open a new file with your preferred text editor:
nano loki-local-config.yamlPaste the following configuration into the file:
auth_enabled: false

server:
  http_listen_port: 3100
  grpc_listen_port: 9096
ingester:
  lifecycler:
    address: 10.**.**.**
    ring:
      kvstore:
        store: inmemory
      replication_factor: 1
    final_sleep: 0s
  chunk_idle_period: 1h
  max_chunk_age: 1h
  chunk_target_size: 1048576
  chunk_retain_period: 30s
  max_transfer_retries: 0
schema_config:
  configs:
    - from: 2020-10-24
      store: boltdb-shipper
      object_store: filesystem
      schema: v11
      index:
        prefix: index_
        period: 24h
storage_config:
  boltdb_shipper:
    active_index_directory: /loki/boltdb-shipper-active
    cache_location: /loki/boltdb-shipper-cache
    cache_ttl: 24h
    shared_store: filesystem
  filesystem:
    directory: /loki/chunks
compactor:
  working_directory: /tmp/loki/boltdb-shipper-compactor
  shared_store: filesystem
limits_config:
  reject_old_samples: true
  reject_old_samples_max_age: 168h
chunk_store_config:
  max_look_back_period: 0s
table_manager:
  retention_deletes_enabled: false
  retention_period: 0s
ruler:
  storage:
    type: local
    local:
      directory: /loki/rules
  rule_path: /tmp/loki/rules-temp
  alertmanager_url: http://**.**.**:9093
  ring:
    kvstore:
      store: inmemory
  enable_api: true
1.5 Create Systemd Service for Loki
Create a service file to manage Loki with systemd.
nano /etc/systemd/system/loki.serviceAdd the following content:
[Unit]
Description=Grafana Loki service
After=network.target

[Service]
Type=simple
User=root
ExecStart=/opt/loki/loki-linux-amd64 -config.file /opt/loki/loki-local-config.yaml
[Install]
WantedBy=multi-user.target
1.6 Start Loki Service
Reload the systemd daemon, enable the Loki service to start on boot, and start it.
systemctl daemon-reload
systemctl enable loki
systemctl start loki
systemctl status loki
1.7 Configure Firewall
Allow traffic on port 3100 through the firewall.
firewall-cmd --zone=public --add-port=3100/tcp --permanent
firewall-cmd --reload
You can verify that the port is open with:
netstat -tulnpStep 2: Install Promtail
Promtail is an agent which ships the contents of local logs to a Loki instance. We’ll set it up on a server with PostgreSQL to monitor the logs.
2.1 Create Promtail Directory
Create a directory for Promtail.
mkdir /opt/promtail
cd /opt/promtail
2.2 Download and Extract Promtail
Download and extract the latest Promtail release from GitHub.
wget https://github.com/grafana/loki/releases/download/v2.9.8/promtail-linux-amd64.zip
unzip promtail-linux-amd64.zip
cp promtail-linux-amd64 /usr/local/bin
2.3 Configure Promtail
Create a configuration file for Promtail.
nano config-promtail.ymlPaste the following configuration into the file, making sure to replace 10.5.56.67 with the IP address of your Loki server and verify the path to your PostgreSQL logs:
server:
  http_listen_port: 9080
  grpc_listen_port: 0
positions:
  filename: /tmp/positions.yaml

clients:
  - url: 'http://10.5.56.67:3100/loki/api/v1/push'
scrape_configs:
  - job_name: system
    static_configs:
      - targets:
          - localhost
        labels:
          job: postgresql_db
          __path__: /var/data/log/*.log
2.4 Create Systemd Service for Promtail
Create a service file to manage Promtail with systemd.
nano /etc/systemd/system/promtail.serviceAdd the following content:
[Unit]
Description=Promtail service
After=network.target

[Service]
Type=simple
User=root
ExecStart=/usr/local/bin/promtail-linux-amd64 -config.file /opt/promtail/config-promtail.yml

[Install]
WantedBy=multi-user.target
2.5 Start Promtail Service
Reload the systemd daemon, enable the Promtail service to start on boot, and start it.
systemctl daemon-reload
systemctl enable promtail
systemctl start promtail
systemctl status promtail
2.6 Configure Firewall
Allow traffic on port 9080 through the firewall.
firewall-cmd --zone=public --add-port=9080/tcp --permanent
firewall-cmd --reload
Verify that the port is open with:
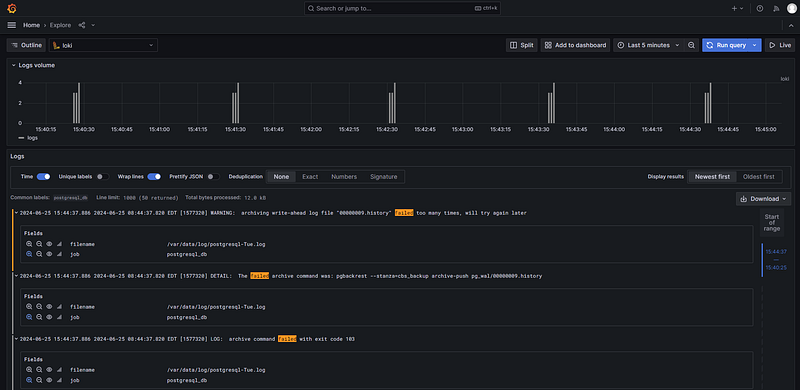
netstat -tulnp2.7 Monitor
Now, add new data source and select loki your source. Also, you can enter url such as http://10.**.**.**:3100. Lastly, you can save and test.
Conclusion
You now have Loki and Promtail set up to monitor your PostgreSQL logs. Loki is configured to collect and store log data, while Promtail is set to scrape PostgreSQL logs and send them to Loki. You can visualize and query these logs using Grafana, making it easier to monitor the health and performance of your PostgreSQL database. This setup not only enhances your logging infrastructure but also provides a scalable and efficient way to manage logs across your systems. For more detailed and technical articles like this, keep following our blog on Medium. If you have any questions or need further assistance, feel free to reach out in the comments below and directly.