 ← PostgreSQL Blog
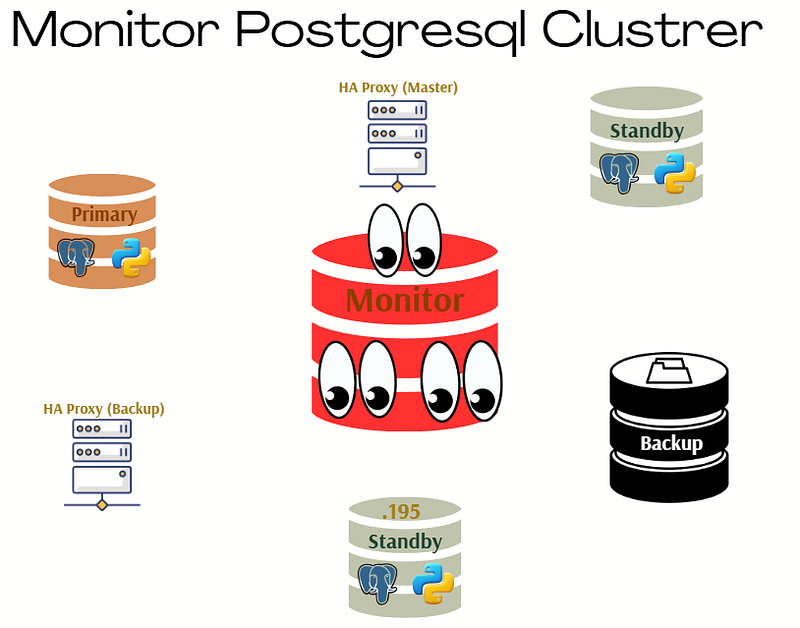
Monitoring PostgreSQL Cluster: Server, Database and Logs
Monitoring PostgreSQL Cluster: Server, Database and Logs
In today’s fast-paced IT environment, system performance and uptime are non-negotiable. In this guide, we break down the art of Linux monitoring into three essential parts — node monitoring, database monitoring, and log monitoring. We’ll start by exploring basic yet powerful Linux commands like top and htop, then dive into modern tools such as Prometheus, Grafana, and Node Exporter for detailed system insights. Next, we cover database monitoring with hands-on techniques using pg_activity and Postgres Exporter, ensuring your PostgreSQL environment is fully observed. Finally, we tackle log monitoring by combining traditional commands with advanced solutions like Loki and Promtail, integrated seamlessly with Grafana for a complete, real-time overview. This comprehensive approach not only helps you keep a pulse on your systems but also empowers you to proactively address potential issues before they impact your operations. Whether you’re a seasoned sysadmin or just getting started, this guide provides the tools and techniques needed to achieve peak performance and reliability. This guide is divided into three key parts:
- Node Monitoring
- Database Monitoring
- Log Monitoring
1. Node Monitoring
Basic Linux Monitoring Commands
Before diving into advanced tools, it’s essential to understand the fundamental Linux commands for system monitoring:
top– Displays real-time system information including CPU and memory usage.

htop– A more user-friendly version oftop.

vmstat– Reports on system performance, including memory, CPU, and I/O statistics.

iostat– Monitors CPU load and disk usage.

Setting Up Prometheus and Grafana for Node Monitoring
Install Grafana
dnf install grafana
systemctl start grafana
To avoid SELinux permission issues, switch to permissive mode:
sudo getenforce
sudo setenforce 0
Install Prometheus
Create a script to automate installation:
vim install_prometheus.shPaste the following:
#!/bin/bash

set -e  # Hata olursa scripti durdurur.

PROM_VERSION="3.2.1"
PROM_USER="prometheus"
PROM_GROUP="prometheus"
INSTALL_DIR="/opt"
CONFIG_DIR="/etc/prometheus"
DATA_DIR="/var/lib/prometheus"
BIN_DIR="/usr/local/bin"
SERVICE_FILE="/etc/systemd/system/prometheus.service"

# Prometheus kullanıcısını oluştur
if ! id "$PROM_USER" &>/dev/null; then
    useradd --no-create-home --shell /bin/false "$PROM_USER"
fi

# Prometheus'u indir ve çıkar
cd "$INSTALL_DIR"
wget "https://github.com/prometheus/prometheus/releases/download/v$PROM_VERSION/prometheus-$PROM_VERSION.linux-amd64.tar.gz"
tar -xzvf "prometheus-$PROM_VERSION.linux-amd64.tar.gz"
cd "prometheus-$PROM_VERSION.linux-amd64"

# Binary dosyalarını taşı
cp prometheus promtool "$BIN_DIR"

# Konfigürasyon dizinlerini oluştur
mkdir -p "$CONFIG_DIR" "$DATA_DIR"
cp prometheus.yml "$CONFIG_DIR/"

# Yetkileri ayarla
chown -R "$PROM_USER:$PROM_GROUP" "$CONFIG_DIR" "$DATA_DIR"
chmod -R 775 "$CONFIG_DIR"

# Systemd servisini oluştur
cat <<EOF > "$SERVICE_FILE"
[Unit]
Description=Prometheus
Documentation=https://prometheus.io/docs/introduction/overview/
Wants=network-online.target
After=network-online.target

[Service]
Type=simple
User=$PROM_USER
Group=$PROM_GROUP
ExecReload=/bin/kill -HUP \$MAINPID
ExecStart=$BIN_DIR/prometheus \\
  --config.file=$CONFIG_DIR/prometheus.yml \\
  --storage.tsdb.path=$DATA_DIR \\
  --web.listen-address=0.0.0.0:9090 \\
  --web.external-url=

SyslogIdentifier=prometheus
Restart=always

[Install]
WantedBy=multi-user.target
EOF

# Systemd işlemlerini yap
systemctl daemon-reload
systemctl enable prometheus
systemctl start prometheus

echo "✅ Prometheus kurulumu tamamlandı ve çalışıyor!"
Make the script executable and run it:
chmod +x install_prometheus.sh
./install_prometheus.sh
Install Node Exporter
vim install_node_exporter.shPaste the following:
#!/bin/bash

set -e  # Hata olursa scripti durdurur.

NODE_EXPORTER_VERSION="1.9.0"
INSTALL_DIR="/opt/node_exporter"
BIN_PATH="/usr/local/bin/node_exporter"
SERVICE_FILE="/etc/systemd/system/node-exporter.service"
NODE_USER="node_exporter"

# Node Exporter kullanıcısını oluştur
if ! id "$NODE_USER" &>/dev/null; then
    useradd --no-create-home --shell /bin/false "$NODE_USER"
fi

# Node Exporter için gerekli dizini oluştur
mkdir -p "$INSTALL_DIR"
cd "$INSTALL_DIR"

# Node Exporter'ı indir
wget -q "https://github.com/prometheus/node_exporter/releases/download/v$NODE_EXPORTER_VERSION/node_exporter-$NODE_EXPORTER_VERSION.linux-amd64.tar.gz"

# Node Exporter'ı çıkar
tar -xzvf "node_exporter-$NODE_EXPORTER_VERSION.linux-amd64.tar.gz"

# Binary dosyasını taşı
mv "node_exporter-$NODE_EXPORTER_VERSION.linux-amd64/node_exporter" "$BIN_PATH"

# Dosya sahibini değiştir
chown "$NODE_USER:$NODE_USER" "$BIN_PATH"

# Systemd servisini oluştur
cat <<EOF > "$SERVICE_FILE"
[Unit]
Description=Node Exporter
After=network.target

[Service]
User=$NODE_USER
Group=$NODE_USER
Type=simple
ExecStart=$BIN_PATH

[Install]
WantedBy=multi-user.target
EOF

# Systemd işlemlerini yap
systemctl daemon-reload
systemctl enable node-exporter
systemctl start node-exporter

echo "✅ Node Exporter kurulumu tamamlandı ve çalışıyor!"
Make it executable and run:
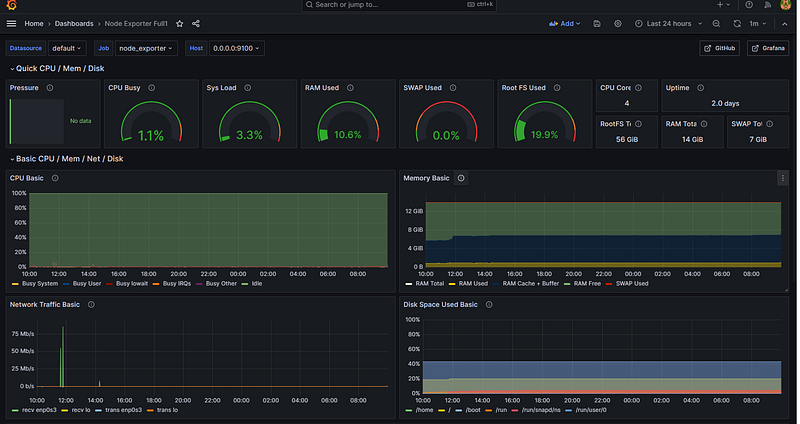
chmod +x install_node_exporter.sh
./install_node_exporter.sh
you can monitor your node;
2. Database Monitoring
Using pg_activity
pg_activity is a powerful tool for real-time PostgreSQL monitoring. Install it with:
dnf install pg_activityRun it:
pg_activity -U postgresMonitor:

Using Prometheus and Postgres Exporter
Install Postgres Exporter
vim install_postgres_exporter.shPaste:
#!/bin/bash
set -e  # Hata olursa scripti durdurur.

EXPORTER_VERSION="0.17.1"
INSTALL_DIR="/opt/postgres_exporter"
BIN_PATH="/usr/local/bin/postgres_exporter"
SERVICE_FILE="/etc/systemd/system/postgres_exporter.service"
ENV_FILE="$INSTALL_DIR/postgres_exporter.env"
PG_USER="postgres"

# Postgres Exporter dizinini oluştur
mkdir -p "$INSTALL_DIR"
cd "$INSTALL_DIR"

# Postgres Exporter'ı indir
wget -q "https://github.com/prometheus-community/postgres_exporter/releases/download/v$EXPORTER_VERSION/postgres_exporter-$EXPORTER_VERSION.linux-amd64.tar.gz"

# Dosyayı çıkart
tar -xzvf "postgres_exporter-$EXPORTER_VERSION.linux-amd64.tar.gz"

# Binary dosyasını taşı
mv "postgres_exporter-$EXPORTER_VERSION.linux-amd64/postgres_exporter" "$BIN_PATH"

# Dosya sahibini değiştir
chown "$PG_USER:$PG_USER" "$BIN_PATH"

# PostgreSQL bağlantı bilgilerini içeren env dosyasını oluştur
cat <<EOF > "$ENV_FILE"
DATA_SOURCE_NAME="postgresql://postgres:test123@localhost:1907/?sslmode=disable"
EOF

# Dosya izinlerini ayarla
chown "$PG_USER:$PG_USER" "$ENV_FILE"
chmod 600 "$ENV_FILE"

# Systemd servisini oluştur
cat <<EOF > "$SERVICE_FILE"
[Unit]
Description=Prometheus exporter for PostgreSQL
Wants=network-online.target
After=network-online.target

[Service]
User=$PG_USER
Group=$PG_USER
WorkingDirectory=$INSTALL_DIR
EnvironmentFile=$ENV_FILE
ExecStart=$BIN_PATH --web.listen-address=:9187 --web.telemetry-path=/metrics --disable-settings-metrics
Restart=always

[Install]
WantedBy=multi-user.target
EOF

# Systemd işlemlerini yap
systemctl daemon-reload
systemctl enable postgres_exporter
systemctl restart postgres_exporter

# Servis durumunu kontrol et
echo "✅ Postgres Exporter kurulumu tamamlandı!"
systemctl status postgres_exporter --no-pager
Make it executable and run:
chmod +x install_postgres_exporter.sh
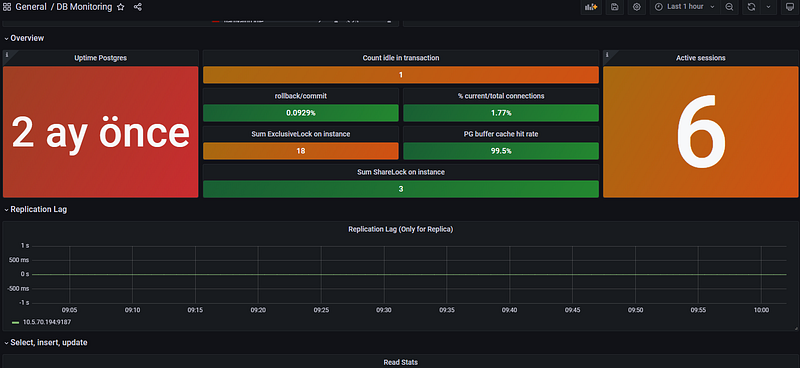
./install_postgres_exporter.shMonitor:
3. Log Monitoring
Using Linux Commands
tail -n 100 /pg_data/log/DATE_last.log– Displays the last 100 lines of the postgres log.
Setting Up Loki and Promtail
Install Loki
vim install_loki.shPaste:
#!/bin/bash
set -e  # Hata durumunda scripti durdurur.

LOKI_VERSION="3.4.2"
INSTALL_DIR="/opt/loki"
CONFIG_FILE="$INSTALL_DIR/loki-local-config.yaml"
SERVICE_FILE="/etc/systemd/system/loki.service"

# Gerekli dizinleri oluştur
mkdir -p "$INSTALL_DIR"
mkdir -p /tmp/loki /loki

# Loki'yi indir ve çıkar
cd "$INSTALL_DIR"
wget -q "https://github.com/grafana/loki/releases/download/v$LOKI_VERSION/loki-linux-amd64.zip"
unzip -o loki-linux-amd64.zip
chmod +x loki-linux-amd64

# Loki konfigürasyon dosyasını oluştur
cat <<EOF > "$CONFIG_FILE"
auth_enabled: false

server:
  http_listen_port: 3100
  grpc_listen_port: 9096
  log_level: debug
  grpc_server_max_concurrent_streams: 1000

common:
  instance_addr: 127.0.0.1
  path_prefix: /tmp/loki
  storage:
    filesystem:
      chunks_directory: /tmp/loki/chunks
      rules_directory: /tmp/loki/rules
  replication_factor: 1
  ring:
    kvstore:
      store: inmemory

query_range:
  results_cache:
    cache:
      embedded_cache:
        enabled: true
        max_size_mb: 100

limits_config:
  metric_aggregation_enabled: true

schema_config:
  configs:
    - from: 2020-10-24
      store: tsdb
      object_store: filesystem
      schema: v13
      index:
        prefix: index_
        period: 24h

pattern_ingester:
  enabled: true
  metric_aggregation:
    loki_address: localhost:3100

ruler:
  alertmanager_url: http://localhost:9093

frontend:
  encoding: protobuf

querier:
  engine:
    #    enable_multi_variant_queries: true


EOF

# Systemd servisini oluştur
cat <<EOF > "$SERVICE_FILE"
[Unit]
Description=Grafana Loki service
After=network.target

[Service]
Type=simple
User=root
ExecStart=$INSTALL_DIR/loki-linux-amd64 -config.file $CONFIG_FILE
Restart=always

[Install]
WantedBy=multi-user.target
EOF

# Systemd işlemlerini yap
systemctl daemon-reload
systemctl enable loki
systemctl restart loki

# Servis durumunu göster
echo "✅ Loki kurulumu tamamlandı!"
systemctl status loki --no-pager
Make it executable and run:
chmod +x install_loki.sh
sudo ./install_loki.sh
Install Promtail
vim install_promtail.shPaste:
#!/bin/bash
set -e  # Hata durumunda scripti durdurur.

PROMTAIL_VERSION="3.4.2"
INSTALL_DIR="/opt/promtail"
BIN_PATH="/usr/local/bin/promtail-linux-amd64"
CONFIG_FILE="$INSTALL_DIR/config-promtail.yml"
SERVICE_FILE="/etc/systemd/system/promtail.service"

# Gerekli dizinleri oluştur
mkdir -p "$INSTALL_DIR"

# Promtail'i indir ve çıkar
cd "$INSTALL_DIR"
wget -q "https://github.com/grafana/loki/releases/download/v$PROMTAIL_VERSION/promtail-linux-amd64.zip"
unzip -o promtail-linux-amd64.zip
chmod +x promtail-linux-amd64
mv promtail-linux-amd64 "$BIN_PATH"

# Promtail konfigürasyon dosyasını oluştur
cat <<EOF > "$CONFIG_FILE"
server:
  http_listen_port: 9080
  grpc_listen_port: 0

positions:
  filename: /tmp/positions.yaml

clients:
  - url: 'http://0.0.0.0:3100/loki/api/v1/push'

scrape_configs:
  - job_name: system
    static_configs:
      - targets:
          - localhost
        labels:
          job: postgresql_db
          __path__: /var/data/log/*.log
EOF

# Systemd servisini oluştur
cat <<EOF > "$SERVICE_FILE"
[Unit]
Description=Promtail service
After=network.target

[Service]
Type=simple
User=root
ExecStart=$BIN_PATH -config.file $CONFIG_FILE
Restart=always

[Install]
WantedBy=multi-user.target
EOF

# Systemd işlemlerini yap
systemctl daemon-reload
systemctl enable promtail
systemctl restart promtail

# Servis durumunu göster
echo "✅ Promtail kurulumu tamamlandı!"
systemctl status promtail --no-pager
Run:
chmod +x install_promtail.sh
sudo ./install_promtail.sh
Monitor;
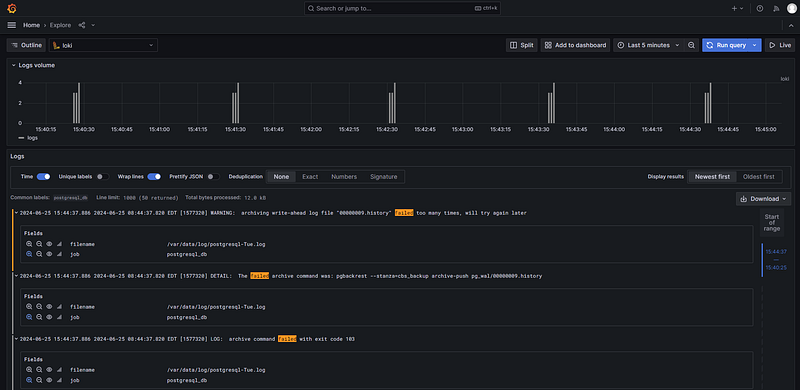
Automating Log Monitoring;
One of the most critical aspects of database management is log monitoring. Instead of manually checking logs for errors, we can automate this process by scanning the PostgreSQL logs for specific error patterns and sending email alerts when issues occur. Below is a Bash script that checks the PostgreSQL log file for critical messages such as database shutdowns, deadlocks, fatal errors, or other issues. If any error is detected, the script sends an email notification to the database administrator.
Example Script:
. ~/.bash_profile

# Specify Directories
export PGCLIENTENCODING="UTF8"

DBNAME="test"
DBA_MAIL='ozk17@itu.edu.tr'
DBA_EMAIL_FROM='************'
#SMTP="**.**.**.**:25"
TMPDIR=/var/lib/pgsql/scripts/log
LOGDIR=/pg_log/log


#------------------------------------------------------------------------
# Initialization
#------------------------------------------------------------------------
    l_err=0
    l_date=`date '+%m%d%H%M%S'`
    l_log=${TMPDIR}/${DBNAME}.log
    l_alertfile=${LOGDIR}/$(ls -t ${LOGDIR} |head -n 1)

    echo `date '+%m/%d/%y %A %X'` "*** log BEGIN ***" > $l_log
    echo "----------------------------------------------------------------" >> $l_log
    echo "Script      : "$0 >> $l_log
    echo "Database    : "$DBNAME >> $l_log
    echo "Server      : "`uname -n` >> $l_log
    echo "----------------------------------------------------------------\n" >> $l_log

#------------------------------------------------------------------------
# Check the alert log file for any errors and clean it
#------------------------------------------------------------------------
    echo  ${l_alertfile}
    if ( test -r ${l_alertfile} )
    then
      #---------------------------------------------------------
      #Check the alert log file for database startup and shutdown
      #---------------------------------------------------------
      if test `grep "database system was shut down" ${l_alertfile} | wc -l` -ne 0
      then
        l_err=1
        echo "DIKKAT DB SHUTDOWN YAPILMIS!\n" >> $l_log
      fi
      if test `grep "Deadlock detected" ${l_alertfile} | wc -l` -ne 0
      then
        l_err=1
        echo "DIKKAT DEADLOCK OLUSTU!\n" >> $l_log
      fi
      if test `grep "database system is shut down" ${l_alertfile} | wc -l` -ne 0
      then
        l_err=1
        echo "DIKKAT DB ABORT OLMUS!\n" >> $l_log
      fi

      if test `grep "database system is ready to accept connections" ${l_alertfile} | wc -l` -ne 0
      then
        l_err=1
        echo "DIKKAT DB STARTUP YAPILMIS!\n" >> $l_log
      fi
      echo  ${l_alertfile}
      if test `grep "ERROR" ${l_alertfile} | grep -v "SELECT logfile_data_id FROM" |grep -v "syntax error at or near"|grep -v"arcgis.sde_logfiles"| grep -v "canceling statement due to statement timeout" |grep -v "duplicate key value violates unique constraint"| grep -v "idle" | wc -l` -ne 0
      then
        l_err=1
        echo "There is an ERROR in the postgres alert log file!\n" >> $l_log
        grep "ERROR" ${l_alertfile} >> $l_log
      else
        echo "There are NO errors in the postgres alert log file" >> $l_log
      fi

          if test `grep "FATAL" ${l_alertfile} |grep -v "rest_publisher_admin" | wc -l` -ne 0
      then
        l_err=1
        echo "There is a FATAL error in the postgres alert log file!\n" >> $l_log
        grep "FATAL" ${l_alertfile} >> $l_log
      else
        echo "There are NO errors in the postgres alert log file" >> $l_log
      fi
    fi

        # Make a copy of the alert log file only if it's not empty
        #----------------------------------------------------------
        if test $l_err -eq 1
        then
        if test `cat ${l_alertfile} | wc -l` -ne 0
        then
                /usr/pgsql-13/bin/psql -c "select pg_rotate_logfile()"
        fi
        fi

    echo "\n----------------------------------------------------------------" >> $l_log
    echo `date '+%m/%d/%y'` `date '+%H:%M:%S'` "*** log END ***" >>  $l_log

#------------------------------------------------------------------------
# Send errors to DBA
#------------------------------------------------------------------------
    if test $l_err -eq 1
    then
#    mailx -v -s "ERROR - ${DBNAME}" -r ${DBA_EMAIL_FROM} -S smtp=${SMTP} ${DBA_MAIL} < $l_log
    mailx -v -s "ERROR - ${DBNAME}" -r ${DBA_EMAIL_FROM}  ${DBA_MAIL} < $l_log
    fi

#  esac
#done
# -----------------------------------------------------------------------
# Olusan logfile lar ve trace file lar 30 gun kalacak sekilde silinir.
# -----------------------------------------------------------------------
#find ${LOGDIR}/postgresql-*.csv -mtime +30 -exec \rm {} \;
find ${LOGDIR}/postgresql-*.log -mtime +30 -exec \rm {} \;
#-----------------------------------------------------
# End of file
By implementing this script and aoutomate below crontab script, you can proactively monitor database health and avoid unexpected failures.
00,15,30,45 * * * * /var/lib/pgsql/scripts/log.shConclusion
Monitoring is the backbone of a well-maintained IT infrastructure, ensuring optimal performance, reliability, and quick incident response. In this guide, we explored three crucial aspects of Linux monitoring: node monitoring, database monitoring, and log monitoring. By leveraging fundamental Linux commands and advanced tools like Prometheus, Grafana, Node Exporter, pg_activity, Postgres Exporter, Loki, and Promtail, you now have a solid framework to observe and analyze your systems in real time. From keeping track of CPU, memory, and disk usage to monitoring database performance and efficiently managing logs, these techniques provide a proactive approach to system health. Implementing a robust monitoring strategy not only helps you detect and resolve issues before they escalate but also enhances overall operational efficiency. Whether you’re fine-tuning a single server or managing a complex infrastructure, these insights empower you to maintain peak performance and ensure uptime.