 ← PostgreSQL Blog
PostgreSQL Performance Trick (EXPLAIN ANALYZE)
PostgreSQL Performance Trick (EXPLAIN ANALYZE)
Stop guessing why your query is slow. Learn to read the map.
We’ve all been there. The application is slow, the CPU is spiking, and the boss is asking questions. You look at the query, and it looks fine. But PostgreSQL thinks otherwise.
Performance tuning isn’t about magic; it’s about mechanics. It’s about understanding how PostgreSQL interacts with your Linux server’s memory and disk.
In this guide, we won’t just talk theory. We will create a lab environment with 1 million rows, break it with a bad query, analyze the “Parallel Seq Scan” disaster using real lab data, and fix it — all while decoding the cryptic EXPLAIN ANALYZE output.

Part 1: The Lab Setup (Do Try This at Home)
To understand performance, we need chaos. A table with 10 rows won’t teach you anything because everything is fast in memory. We need volume.
Run this SQL script in your local PostgreSQL instance to generate a realistic E-Commerce Order Log (1 Million Rows):
-- 1. Create the Table
CREATE TABLE orders (
    id SERIAL PRIMARY KEY,
    user_id INT,
    order_date TIMESTAMP,
    amount DECIMAL(10, 2),
    status TEXT
);

-- 2. Insert 1 Million Rows (The Magic)
-- generate_series helps us simulate chaos quickly.
INSERT INTO orders (user_id, order_date, amount, status)
SELECT
    (random() * 10000)::INT,
    NOW() - (random() * interval '365 days'),
    (random() * 1000)::DECIMAL,
    CASE WHEN random() < 0.1 THEN 'FAILED' ELSE 'COMPLETED' END
FROM generate_series(1, 1000000);


-- 3. Update Statistics (Crucial!)
ANALYZE orders;
Part 2: The Disaster (Parallel Sequential Scan)
Let’s run a simple query: “Find all orders for User ID 42.”
Since we haven’t created an index yet, PostgreSQL has no map. It has to read the entire book.
EXPLAIN (ANALYZE, BUFFERS)
SELECT * FROM orders WHERE user_id = 42;
The Output (From Our Lab):
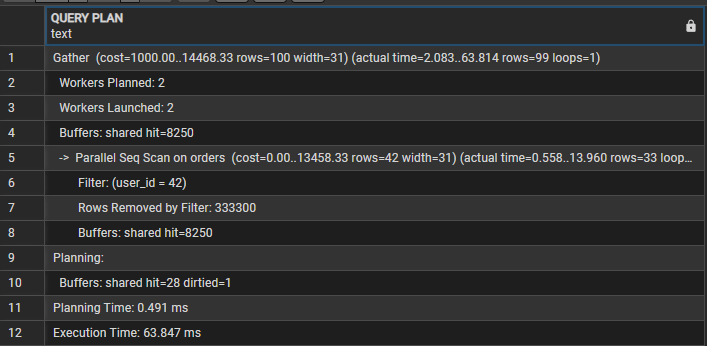
Gather  (cost=1000.00..14468.33 rows=100 width=31) (actual time=2.083..63.814 rows=99 loops=1)
  Workers Planned: 2
  Workers Launched: 2
  Buffers: shared hit=8250
  ->  Parallel Seq Scan on orders  (cost=0.00..13458.33 rows=42 width=31) (actual time=0.558..13.960 rows=33 loops=3)
        Filter: (user_id = 42)
        Rows Removed by Filter: 333300
        Buffers: shared hit=8250
Planning:
  Buffers: shared hit=28 dirtied=1
Planning Time: 0.491 ms
Execution Time: 63.847 ms
Decoding the Output: The 3 Red Flags
Most developers see “Parallel Scan” and think, “Great, it’s using multi-core!”. Wrong. This is a brute-force attack on your CPU.
1. The “Loops=3” Trap
Look closely: Workers Launched: 2 but loops=3.
- Math: 2 Workers + 1 Leader Process = 3 Processes.
- The database split the table into 3 chunks and scanned them simultaneously.
2. The “Rows Removed” Deception
It says Rows Removed by Filter: 333300.
- This is the average per loop.
- Reality: $333,300 \times 3 \approx 1,000,000$ rows.
- Verdict: To find just 99 rows, PostgreSQL read 1 million rows and threw away almost all of them. This is wildly inefficient.
3. The Buffer Hit (Linux Connection)
Buffers: shared hit=8250.
- PostgreSQL pages are 8KB.
- $8250 \times 8KB \approx 64.5 MB$.
- Your CPU just processed ~64.5MB of data for a query that should return a few Kilobytes.
Part 3: The Fix (Index Scan & Bitmap Magic)
Now, let’s give the database a map.
CREATE INDEX idx_orders_user_id ON orders(user_id);Rerunning the exact same query:
EXPLAIN (ANALYZE, BUFFERS)
SELECT * FROM orders WHERE user_id = 42;
The Output (The Hero Moment):

Bitmap Heap Scan on orders  (cost=5.20..373.42 rows=100 width=31) (actual time=0.055..0.149 rows=99 loops=1)
  Recheck Cond: (user_id = 42)
  Heap Blocks: exact=98
  Buffers: shared hit=98 read=3
  ->  Bitmap Index Scan on idx_orders_user_id  (cost=0.00..5.17 rows=100 width=0) (actual time=0.046..0.046 rows=99 loops=1)
        Index Cond: (user_id = 42)
        Buffers: shared read=3
Planning:
  Buffers: shared hit=15 read=1
Planning Time: 0.455 ms
Execution Time: 0.165 ms
Decoding the Output: Why “Bitmap”?
You might have expected a simple Index Scan. Instead, PostgreSQL chose a Bitmap Heap Scan. Why?
1. The Mechanics (Smart Batching)
- Step 1 (Bitmap Index Scan): PostgreSQL first looked at the index (
idx_orders_user_id) to find the locations of all 99 rows. It didn't visit the table yet; it just built a "map" (Bitmap) in memory. - Step 2 (Bitmap Heap Scan): It sorted these locations physically and visited the main table (Heap) in order, reducing random I/O.
2. The Comparison (The Math)
If we didn’t have an index, PostgreSQL would have performed a Sequential Scan. Here is the difference based on our lab results:
Performance_Comparison:
 Strategy:
 Sequential_Scan_Bad: "Read 1 Million Rows"
 Bitmap_Heap_Scan_Good: "Read only 99 Rows"
 Impact: "Precision"

Buffers_IO:
 Sequential_Scan_Bad: "8,250 Pages (64.5 MB)"
 Bitmap_Heap_Scan_Good: "101 Pages (~800 KB)"
 Impact: "~80x Less I/O"

Execution_Time:
 Sequential_Scan_Bad: "~63.8 ms"
 Bitmap_Heap_Scan_Good: "~0.16 ms"
Impact: "~385x Faster"- Sequential Scan: Reads the entire book (1M rows) just to find one page.
- Bitmap Scan: Uses the table of contents (Index) to go directly to the page.
Part 4: Advanced Metrics (The “Hidden” Details)
This is where you spot the difference between a “fast query” and a “healthy query”.
1. Buffers: Shared Hit vs. Read
Look at your output: Buffers: shared hit=98 read=3.
- Shared Hit: The data was already in RAM. Super fast.
- Shared Read: The data was on the Disk. PostgreSQL had to ask Linux to fetch it.
- Insight: Seeing
read=3means the index was slightly "cold" (not in memory). If you run it again, thosereads will turn intohits, and the time will drop even further.
2. “Dirtied” Buffers (The Maintenance Cost)
If you see dirtied=1 in the planning section:
- It means PostgreSQL had to update some metadata on a page while reading it.
- In a heavy write environment, if you see high
dirtiedcounts on aSELECTquery, it means your Autovacuum might be lagging, and your read queries are paying the price for cleanup.
Summary: How to Read EXPLAIN Like a Pro
- Always use
(ANALYZE, BUFFERS): Estimates are often wrong. Buffers never lie. - Low Buffers = High Speed: Don’t obsess over execution time (ms), as it fluctuates. Focus on reducing
Buffers. If you lower the I/O, the speed will follow. - Bitmap vs. Seq Scan: If you see a
Seq Scanon a large table with aFilterremoving 99% of rows, you are burning CPU. Add an index to switch toIndex ScanorBitmap Heap Scan.