 ← PostgreSQL Blog
PostgreSQL Logs
PostgreSQL Logs
While PostgreSQL is powerful out of the box, going beyond standard settings is essential for enterprise-grade compliance and performance analysis. This guide provides an in depth look at PostgreSQL’s built in logging mechanisms and auditing capabilities.
Table of Contents
1. PostgreSQL Logging Fundamentals
- Rationale: Why should we maintain logs?
- Critical Parameters:
logging_collectorandlog_destination - Log File Management: Rotation, permissions, and naming conventions
2. Advanced Log Configuration
log_line_prefix: Creating meaningful traces- Connection and Error Tracking:
log_connections,log_error_verbosity - Performance Analysis Settings:
log_min_duration_statement
3. Deep Auditing with pgAudit
- Installation and Activation: Enabling the pgAudit extension
- Session vs. Object Audit: Understanding the differences
- The
pgaudit.logParameter: Tracking Read, Write, and DDL operations
4. Log Analysis: Using pgBadger
- pgBadger Installation
- Generating Visual Reports: From raw logs to actionable insights
- Report Interpretation: Identifying slow queries and error analysis
5. Best Practices
- External Log Storage: Keeping log files outside of
PGDATA - Disk Space Management and Security Hardening
1. PostgreSQL Logging Fundamentals
1.1. Rationale: Why Maintain Logs?
For a DBA or System Administrator, logs are the black box of the database. They are essential not just for debugging, but for three core pillars:
- Security and Auditing: Answering the critical question: Who accessed which data?
- Performance Monitoring: Identifying slow queries to resolve bottlenecks.
- Regulatory Compliance: Ensuring traceability for standards such as GDPR, HIPAA, or ISO27001.
1.2. Critical Parameters: logging_collector and log_destination
To initiate the logging process, you must first define how and where these messages are recorded.
logging_collector
This parameter enables a background log collector process. It captures all messages sent to stderr (standard error output) and redirects them into files.
- Why should it be ON? If disabled, logs may only exist at the operating system level (e.g., journald/syslog), making them much harder to manage and analyze.
-- Check current status
SHOW logging_collector;

-- Enable (Requires restart)
ALTER SYSTEM SET logging_collector = 'on';
log_destination
This defines the format in which logs are saved. The most common options are stderr, csvlog, and jsonlog.
- csvlog: The best choice if you plan to load logs into a table for SQL analysis or use tools like PgBadger.
- jsonlog: (PostgreSQL 15+) Ideal for modern log monitoring stacks like ELK (Elasticsearch, Logstash, Kibana) or Splunk.
-- Set format to CSV
ALTER SYSTEM SET log_destination = 'csvlog';
SELECT pg_reload_conf();
1.3. Log File Management: Rotation, Permissions, and Naming
Rotation settings are vital to prevent log files from growing uncontrollably and consuming all disk space.
Log Rotation (Age & Size)
We determine when a new log file should be created — for example, every day (1d) or when a file reaches a specific size (100MB).
-- Create a new log file every 1 day
ALTER SYSTEM SET log_rotation_age = '1d';

-- Trigger rotation when file size reaches 100MB
ALTER SYSTEM SET log_rotation_size = '100MB';
Naming and Permissions (log_filename & log_file_mode)
To prevent file confusion and unauthorized access, use timestamped naming and strict permissions.
log_filename: Using a format likepostgresql-%Y-%m-%d_%H%M%S.logensures files are sorted chronologically.log_file_mode: Setting this to0600ensures that only the database owner (thepostgresuser) can read the log files.
ALTER SYSTEM SET log_filename = 'postgresql-%Y-%m-%d_%H%M%S.log';
ALTER SYSTEM SET log_file_mode = '0600';
SELECT pg_reload_conf();
Pro Tip: As a Best Practice, store log files on a separate disk partition (mount point) outside of PGDATA (the main data directory). This protects against performance degradation and prevents the database from crashing if the log disk fills up.2. Advanced Log Configuration
Standard logging tells us that the system is running, but Advanced Configuration shows us how the system is breathing.
2.1. Creating Meaningful Traces with log_line_prefix
This prefix, added to the beginning of each log line, forms the identity of every log entry. Without proper configuration, it becomes nearly impossible to identify which user or database a specific error belongs to.
Recommended Ideal Format:
ALTER SYSTEM SET log_line_prefix = '%m [%p]: [%l-1] user=%u,db=%d,app=%a,client=%h ';Meaning of the Characters:
- %m: Timestamp including milliseconds.
- %p: Process ID (PID).
- %u: User name.
- %d: Database name.
- %a: Application name (e.g., pgAdmin, Java App).
- %h: Remote host address of the connection.
2.2. Connection and Error Tracking
For security auditing, it is mandatory to know who logged into the system and what types of errors they encountered.
log_connections & log_disconnections
Records every successful connection and termination. This is critical for detecting brute-force attacks or application-side connection leaks.
ALTER SYSTEM SET log_connections = 'on';
ALTER SYSTEM SET log_disconnections = 'on';
log_error_verbosity
Determines the detail level of error messages.
- TERSE: Only the primary message.
- DEFAULT: Includes details and hints.
- VERBOSE: Shows the exact location of the error in the source code (file and line number). Invaluable for debugging processes.
ALTER SYSTEM SET log_error_verbosity = 'verbose';2.3. Critical Settings for Performance Analysis
The shortest path to resolving slowness complaints in a database is through the log_min_duration_statement parameter.
log_min_duration_statement
Logs all queries that run longer than a specified duration (in milliseconds).
- For example, if set to
5000, all queries taking longer than 5 seconds are recorded as Slow Queries. - If set to
0, every single query is recorded (Warning: This can fill up your disk rapidly on high-traffic systems!).
-- Catch queries exceeding 5 seconds
ALTER SYSTEM SET log_min_duration_statement = 5000;
log_lock_waits
If a query is delayed because it is waiting for a lock held by another query, this parameter ensures it is logged. This data is vital for resolving performance bottlenecks.
ALTER SYSTEM SET log_lock_waits = 'on';2.4. Applying Changes
Most of these settings are activated via SIGHUP (without requiring a full database restart):
SELECT pg_reload_conf();3. Deep Auditing with pgAudit
3.1. Installation and Activation of pgAudit
Since pgAudit is an extension, it must first be installed at the operating system level and then registered within the database.
Installation (RHEL/CentOS Example):
# Install the package corresponding to your PostgreSQL version (e.g., for PG15)
dnf install pgaudit15_15
Activation:
For the extension to function, it must be added to the shared_preload_libraries parameter. This process requires a restart.
-- Set the parameter
ALTER SYSTEM SET shared_preload_libraries = 'pgaudit, pg_stat_statements';

-- Create the extension at the database level
CREATE EXTENSION pgaudit;
3.2. Session vs. Object Audit: Understanding the Differences
pgAudit operates in two primary modes. Understanding this distinction is critical to preventing unnecessary log noise.
FeatureSession AuditObject AuditScopeTracks all actions performed by a user throughout their session.Tracks actions only on specific tables, views, or columns.ConfigurationManaged via the pgaudit.log parameter.Managed by creating a specific role and granting permissions on objects.Use CaseGeneral user tracking and compliance.Special tracking for sensitive data (e.g., Salary tables).
3.3. The pgaudit.log Parameter: Tracking Read, Write, and DDL
We use this parameter to select which specific operations are logged. It provides much more granular detail than PostgreSQL’s standard log_statement setting.
Critical Classes:
- READ: Tracks
SELECTandCOPYoperations. - WRITE: Tracks
INSERT,UPDATE,DELETE, andTRUNCATEoperations. - DDL: Tracks operations like creating, altering, or dropping tables.
- ROLE: Tracks user creation and permission management (
GRANT/REVOKE).
Example Implementation:
To track all data modifications (WRITE) and structural changes (DDL):
-- Log only DDL and Write operations
ALTER SYSTEM SET pgaudit.log = 'ddl, write';

-- Log all operations (Caution: Generates a high volume of logs!)
ALTER SYSTEM SET pgaudit.log = 'all';

-- Reload settings
SELECT pg_reload_conf();
Tip: Thepgaudit.log_catalog = offsetting can reduce log clutter by filtering out queries against system catalogs (pg_catalog). Keeping this settingonis generally recommended unless you need to audit internal system metadata changes.
4. Log Analysis: Using PgBadger
PgBadger is the world’s fastest log analysis tool for PostgreSQL. It scans your log files and transforms them into stunning charts, tables, and statistics.
4.1. PgBadger Installation
PgBadger is Perl-based and does not require a database connection; it simply reads the log files directly.
Installation (RHEL/CentOS):
Bash
dnf install pgbadger(Alternatively, since it is a single Perl script, it can be downloaded from GitHub and executed directly.)
4.2. Generating Visual Reports from Raw Logs
For PgBadger to work correctly, the log_line_prefix setting we discussed earlier must be compatible with the format PgBadger expects.
Report Generation Command: Navigate to the directory containing your log files and run the following:
# Analyze logs for a specific day and generate an HTML report
pgbadger /pg_log/log/postgresql-2024-03-20*.log -o /tmp/report_2024_03_20.html
Powerful Parameters:
- -z: Used if the logs are compressed (
.gz). - -j: Specifies the number of CPU cores to use for parallel processing to speed up analysis.
- - - extra-errors: Adds more in-depth error details to the report.
4.3. Reading the Report: Slowest Queries and Error Analysis
When you open the resulting HTML file in your browser, you will see a full check-up report of your database. Here are the most critical sections to focus on:
1. Top Slowest Queries
PgBadger ranks queries by their execution time. You should look not just for the slowest individual query, but for those with the highest Total Time. A query that takes 1 second but runs 1 million times a day often strains the system more than a 10-minute query that only runs once a month.
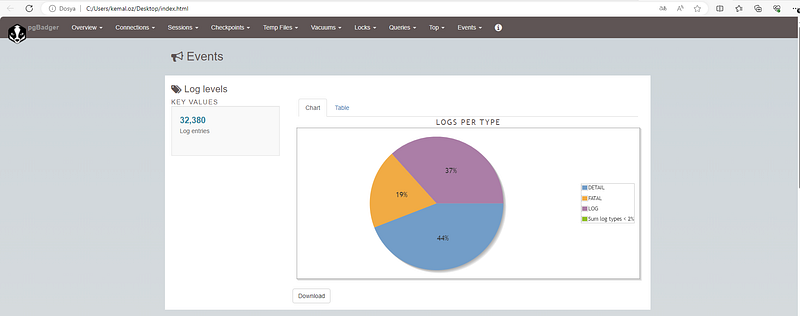
2. Most Frequent Errors (Events by Severity)
This section groups ERROR, FATAL, and PANIC messages. For example, if you frequently see duplicate key value violates unique constraint, you can quickly diagnose a logic error on the application side.
3. Traffic Volume (Temporal Distribution)
This shows you exactly when database traffic peaks. If traffic spikes at 3:00 AM, you can analyze the impact of backups or batch jobs running at that hour.
4.4. Automation Tip
In a real production environment, you wouldn’t generate these reports manually every day. You can set up a crontab job to run every night at 00:01, generating the previous day’s report and automatically emailing it to yourself.
5. Best Practices
Log management is not just about collecting data; it is about preventing that data from threatening system health. Here are the golden rules for a professional environment:
5.1. Keeping Log Files Outside of PGDATA
By default, PostgreSQL stores logs within the main data directory (PGDATA). However, this poses a significant risk for production environments.
Why Move Them?
- Performance: Log writing operations (I/O) will compete for the same disk channel/head as data writing operations.
- Security & Stability: If the disk fills up due to log growth, and
PGDATAis on that same disk, the database will shut itself down (Panic mode). - Backup Efficiency: Logs should generally not be included in daily database backup packages; doing so inflates the backup size unnecessarily.
Implementation: Create a separate disk partition (Logical Volume) for logs and point the directory there:
-- First, create the directory and set permissions at the OS level:
-- mkdir -p /pg_log/log && chown postgres:postgres /pg_log/log

ALTER SYSTEM SET log_directory = '/pg_log/log';
SELECT pg_reload_conf();
5.2. Disk Space Management and Security Hardening
Automated Housekeeping
Log rotation parameters (log_rotation_age and log_rotation_size) control when a new file is created, but they do not delete old files. Without intervention, your disk will eventually fill up.
Solution: Use a cron job or the logrotate service to automatically delete logs older than a specific period (e.g., 30 days).
# A simple cron example that deletes logs older than 30 days every night at 2:00 AM
0 2 * * * find /pg_log/log -name "*.log" -mtime +30 -exec rm {} \;
Security Hardening
Logs contain sensitive information about your system, such as query parameters, table structures, and usernames.
log_file_mode: Must be set to0600. This ensures that only thepostgresuser can read the files.- Parameter Masking: If you want to prevent sensitive data (like passwords or PII) from appearing in logs, keep
pgaudit.log_parameter = off. If parameters are needed for debugging, limit them usinglog_parameter_max_size.
6. Conclusion
Configuring PostgreSQL logging and auditing mechanisms transforms your database from a plane flying in the dark into a modern cockpit with every gauge functioning.
- Logging allows you to monitor the system’s pulse.
- pgAudit equips you with enterprise-grade compliance and a security shield.
- PgBadger turns raw data into meaningful strategic reports.
Remember: The best logging policy is one that includes everything you need, yet remains simple enough not to overwhelm the system.