 ← PostgreSQL Blog
PostgreSQL Performance Report (The AWR Equivalent)
PostgreSQL Performance Report (The AWR Equivalent)
In the Oracle world, AWR (Automatic Workload Repository) is vital; in the PostgreSQL ecosystem, pg_profile holds that crown. This tool provides statistical evidence for everything going sideways in your database, offering bullseye answers to questions like Why is the database slow? or Why is there a disk bottleneck? Let’s move past guesswork and start decoding the reports.
Guide Roadmap
Part 1: Installation, Configuration, and Automation
- Rapid Integration: Including the
pg_profileextension into your system. - Critical Parameters: The monitoring eyes that must be enabled in
postgresql.conf. - Snapshot Management: Manual and automated (Cron) sampling strategies for historical comparisons.
Part 2: Report Analysis and Performance Detective Work
- Wait Events: What is the system really waiting for? (IO, Lock, CPU analysis).
- SQL Statistics: Identifying naughty queries consuming the most resources (IO, Temp, WAL).
- Object & Maintenance: Unused indexes, table growth rates, and the Vacuum (Bloat) scorecard.
- Warnings: Hidden messages and error signals the report whispers to you.
Section 1: Installation, Configuration, and Automation
1.1. Download and Installation
First, we pull the pg_profile package from its official GitHub repository. In this step, ensuring the files are extracted correctly into PostgreSQL’s extension directory is critical for a smooth setup.
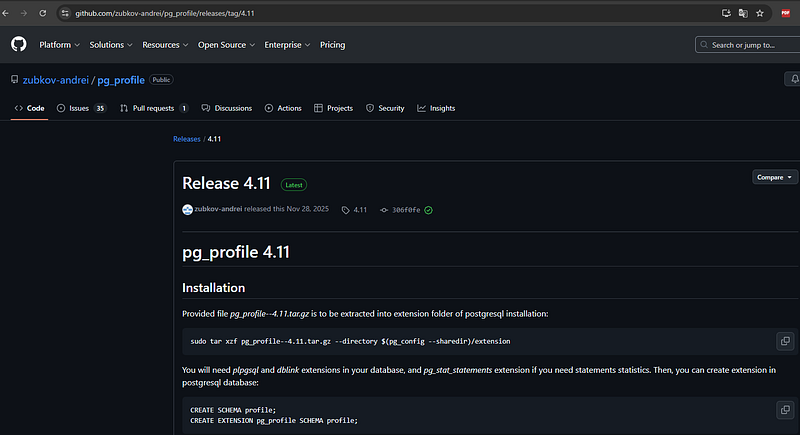
# 1. Download the package from the reliable source
wget https://github.com/zubkov-andrei/pg_profile/releases/download/4.11/pg_profile--4.11.tar.gz

# 2. Extract files to the PostgreSQL extension directory
# (Note: v14 is used as an example; update the path according to your version)
tar -xzf pg_profile--4.11.tar.gz -C /usr/pgsql-14/share/extension/

# 3. Verify that the files are in the correct location
ls -ltr /usr/pgsql-14/share/extension/ | grep pg_profile
1.2. Critical Parameters (Configuration)
For PostgreSQL to analyze the workload effectively, statistics collection modules must be activated. If these settings are ignored, the most critical sections of your report such as I/O details and query statistics will appear empty.
Important: Changing shared_preload_libraries requires a restart of the PostgreSQL service.For Standard PostgreSQL Installations:
Edit your postgresql.conf file with the following parameters:
shared_preload_libraries = 'pg_stat_statements'
track_activities = on
track_counts = on
track_io_timing = on    # Vital for capturing I/O wait events!
track_functions = all
pg_profile.max_sample_age = 30   # How many days should snapshots be retained?
pg_profile.topn = 20             # How many heavy queries should be listed?
For Patroni (High Availability) Environments:
Update the configuration dynamically to ensure consistency across the cluster:
patronictl -c /etc/patroni/patroni.yml edit-configAdd the following under the parameters section:
postgresql:
  parameters:
    shared_preload_libraries: pg_stat_statements
    track_activities: true
    track_counts: true
    track_io_timing: true
    track_functions: all
    pg_profile.max_sample_age: 30
    pg_profile.topn: 10
1.3. Database-Level Setup
Once the files are installed and parameters are set, we need to create the necessary structures (schema and extensions) within the database:
-- Install helper extensions
CREATE EXTENSION dblink;
CREATE EXTENSION pg_stat_statements;

-- Create a dedicated schema for pg_profile data
CREATE SCHEMA profile;
CREATE EXTENSION pg_profile SCHEMA profile;
1.4. Snapshot and Sampling Management
To generate a meaningful report, you need at least two snapshots taken at different points in time. This allows the tool to calculate the delta (change) between them.
Manual Operation Commands:
Manual Operation Commands:
-- List all servers being monitored by pg_profile
SELECT * FROM profile.show_servers();

-- Take a manual snapshot (sampling) of the current database state
SELECT * FROM profile.take_sample();

-- Display all captured snapshots with their unique IDs and timestamps
SELECT * FROM profile.show_samples();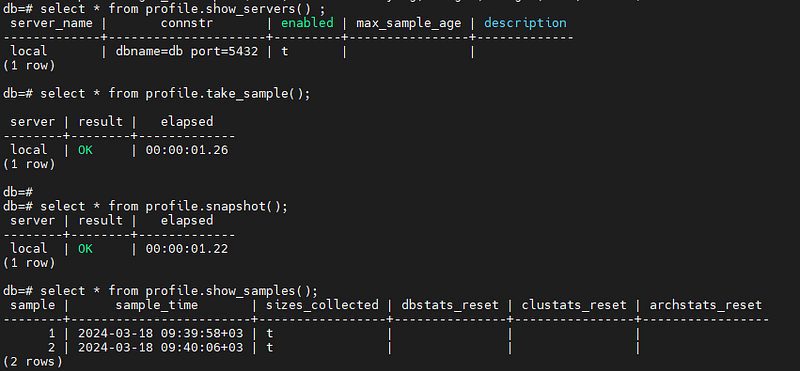
1.5. Automation (Cron Job)
For a truly effective analysis, data must be collected consistently over time. To automate the snapshot process, you should schedule a task that runs at regular intervals.
Adding the following line to your crontab will trigger an automatic snapshot every 30 minutes, ensuring you have a continuous stream of performance data:
# Capture a performance snapshot every 30 minutes
*/30 * * * * psql -U postgres -d postgres -c 'SELECT profile.take_sample()' > /dev/null 2>&1
1.6. Generating the Performance Report
Once you have collected enough snapshots, you can generate a comprehensive HTML report. Using the profile.get_report() function, you simply specify the starting and ending Snapshot IDs that cover the time period you want to analyze.
You can run the following command directly from your terminal to export the report as an HTML file:
# Generate the report between Snapshot ID 22687 and 22688
psql -Aqtc "SELECT profile.get_report(22687,22688)" -o report_22687_22688.html
Pro Tip: In the output file, you will find a visual and interactive dashboard that breaks down everything from CPU spikes to specific query latencies.
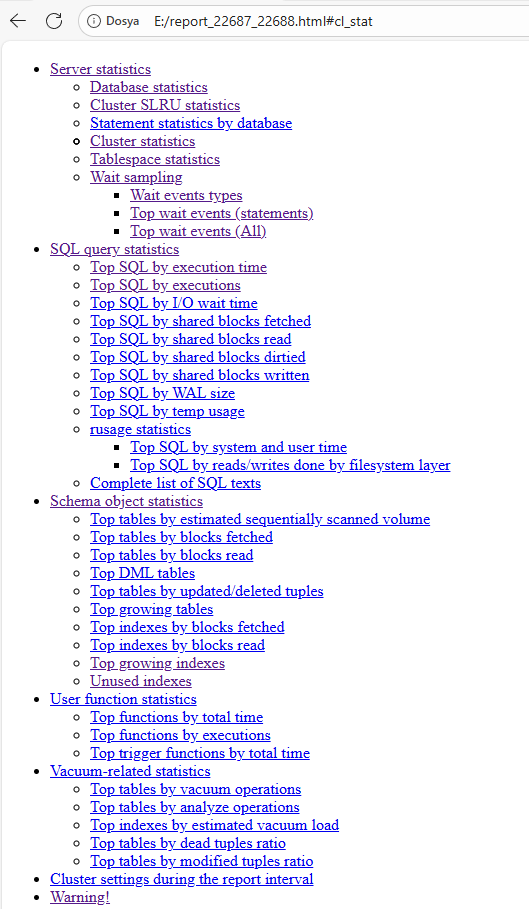
Section 2: Report Analysis and Performance Detective Work
Now that we have gathered the data, it is time to read this complex-looking report like an expert. Instead of getting lost among hundreds of tables when you open the report, you should visit the following crime scenes like a performance detective:
2.1. First Stop: Wait Events (Why is the system waiting?)
The Wait Events table at the beginning of the report reveals exactly where your database is spending its time. This section, a favorite for Oracle DBAs, provides the precise address of the bottleneck in PostgreSQL.
What to look for?
- I/O Events (e.g.,
DataFileRead): If these are at the top, your disks are either too slow or your memory (shared_buffers) is insufficient, forcing the system to go to the disk constantly. - Lock Events: If you see high lock wait times, your queries are contending for the same resources and blocking each other.
- CPU / Scheduler: If CPU usage is the leader, you might have poorly optimized queries performing heavy calculations or massive sorts in memory.
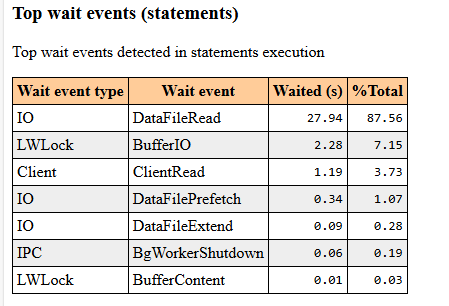
- What to look for? If I/O events (such as
DataFileRead) dominate the top of the list, it means your disk speed cannot keep up with the query demands. In this scenario, your query isn't necessarily poorly written or slow by logic; it is simply wasting time waiting for data to be fetched from the disk.
Critical Warning: Do not jump to conclusions based on a single 30-minute snapshot. Short-term spikes can be misleading. To identify a systemic bottleneck, you must analyze a daily report. Looking at the big picture prevents you from being distracted by momentary glitches.
Action Plan: If the report confirms a persistent I/O bottleneck across multiple snapshots, you should consider the following:
- Query Optimization: Reducing the amount of data being scanned.
- Memory Tuning: Increasing the
shared_buffers(RAM) to keep more data in the cache. - Infrastructure Upgrade: Evaluating the move to faster disk subsystems like SSD or NVMe.
2.2. Second Stop: SQL Statistics (The Naughty Queries)
You should analyze queries not just by their execution time, but by the damage they inflict on the system resources. In pg_profile, focus on these specific categories to find your culprits:
- Top SQL by Execution Time: These are the Elephants. They consume the most cumulative time. Even if they aren’t slow individually, their frequency or total duration impacts overall throughput.

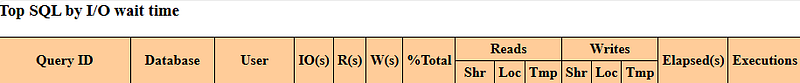
- Top SQL by I/O Wait Time: These queries are the ones stuck in the disk read/write queue. They are often victims of a lack of proper indexing or high data volume.
- Top SQL by Temp Usage: This is critical. If a query starts using temporary files on disk because it ran out of RAM (exceeding
work_mem), it becomes a primary performance killer. Disk-based sorting or hashing is significantly slower than in-memory operations.

2.3. Third Stop: Object Health and Maintenance (Vacuum)
No matter how optimized your queries are, you cannot achieve high performance if your tables are bloated.
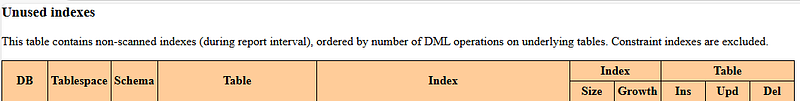
- Unused Indexes: Identify and remove indexes that are never used but continue to slow down every
INSERT,UPDATE, andDELETEoperation.
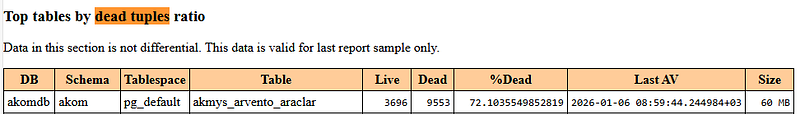
- Top Tables by Dead Tuples Ratio: Check the ratio of deleted data that still occupies space. If this ratio is too high, it is a clear sign that Autovacuum is failing to keep up with the workload.
2.4. Fourth Stop: Warnings! (The Hidden Dangers)
The section at the end of the report is effectively a DBA Alarm. If there are warnings here, you should treat the rest of the data with caution.
Critical Bottleneck: pg_stat_statements.max Capacity
PostgreSQL stores query statistics in RAM, and this memory has a limit. If this limit is reached, even the heaviest, most resource-intensive queries might be excluded from the report.
You can check your current limit with this command:
postgres=# show pg_stat_statements.max;
 pg_stat_statements.max
------------------------
 5000
(1 row)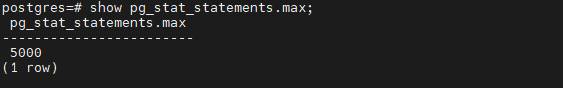
If your database handles a vast variety of unique queries, the default limit of 5000 might not be enough. New naughty queries won’t make it into the list, and you might mistakenly assume everything is fine.
The Solution (Requires Restart): To increase capacity, update your postgresql.conf and restart the service:
pg_stat_statements.max = 10000 # Double the capacitySummary Action Plan
After analyzing the report, you should be able to make these three critical decisions:
- Hardware Bottleneck? (High I/O or CPU in Wait Events)
- Query Logic Issue? (Optimize the top 3 queries in the Top SQL list)
- Indexing Problem? (Check the Unused Indexes and Sequential Scans tables)