← PostgreSQL Blog
PostgreSQL Performance Test
PostgreSQL Performance Test
Measuring your database performance is a critical step to understanding your system’s limits. In this guide, we’ll explore how to conduct stress tests using PostgreSQL’s built-in tool, pgbench.
Table of Contents
Why Use pgbench?
- Simulation of Real-World Workloads
- Baseline Measurement
Step 1: Preparing the Test Database
- Environment Isolation
- Creating the Database
Step 2: Scalable Data Initialization
- Understanding Scale Factors (-s)
- Initializing pgbench Tables
Step 3: Running the Benchmark Test
- Client and Thread Configuration
- Transaction vs. Time-Based Tests
Step 4: Detailed Analysis and Reporting
- Interpreting TPS (Transactions Per Second)
- Logging for Granular Data
Step 5: Monitoring and Visualization
- Database-Level Monitoring
- System-Level Monitoring
Why Use pgbench?
pgbench is a powerful tool included with PostgreSQL that simulates a TPC-B-like workload. It allows you to numerically observe the impact of hardware changes, OS tuning, or configuration settings on database performance.
Step 1: Preparing the Test Database
Environment Isolation
Always perform stress tests in a dedicated environment. This ensures your production data remains safe and your benchmark results are not skewed by existing background processes.
Creating the Database
CREATE DATABASE test_benchmark;
\c test_benchmark;
Step 2: Scalable Data Initialization
Understanding Scale Factors (-s)
The scale factor determines the size of the dataset. A scale factor of 10 (-s 10) generates approximately 1 million rows in the primary accounts table.
Initializing pgbench Tables
Run the initialization command to generate the standard benchmark tables:
pgbench -i -s 10 test_benchmarkStep 3: Running the Benchmark Test
Client and Thread Configuration
Simulate real-world load by adjusting concurrent clients (-c) and worker threads (-j). Ideally, the number of threads should be proportional to your available CPU cores.
Executing the Test
pgbench -c 10 -j 2 -t 1000 test_benchmark- -c 10: 10 concurrent client sessions.
- -j 2: 2 worker threads.
- -t 1000: 1000 transactions per client.
Step 4: Detailed Analysis and Reporting
Interpreting TPS
The TPS (Transactions Per Second) value is the ultimate indicator of your system’s health. A higher TPS means your database can handle more operations under the same load.
Logging for Granular Data
To analyze performance trends over time, save the results to a log file:
pgbench -c 10 -j 2 -t 1000 -l test_benchmark > benchmark_results.logStep 5: Monitoring and Visualization
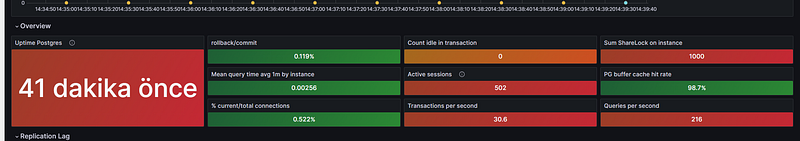
Database-Level Monitoring
Track active sessions, buffer cache hit rates, and query latency during the test to identify internal database bottlenecks.
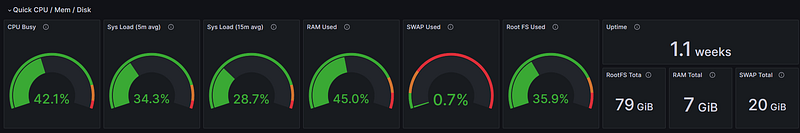
System-Level Monitoring
Monitor hardware limits such as CPU Busy, Sys Load, and RAM/SWAP usage to see how the OS handles the stress applied by the database.